What Is MapLibre GL JS? #
MapLibre GL JS is an open-source, community-maintained fork of Mapbox GL JS v1 — created in 2020 when Mapbox shifted its library to a proprietary license. The project is now backed by AWS, Microsoft, Meta, Esri, and dozens of independent contributors under the MapLibre Organization.
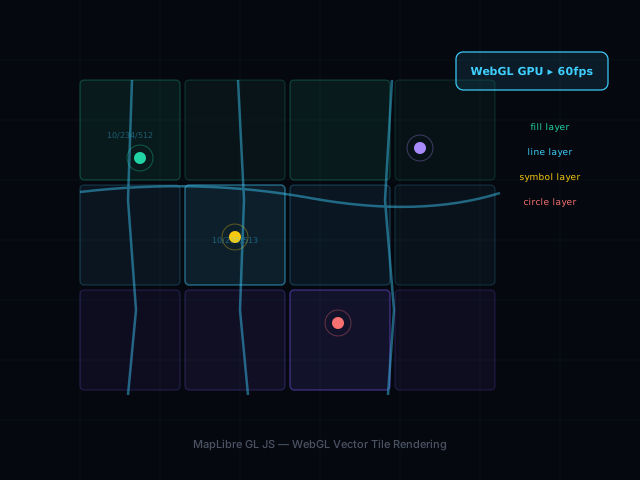
Unlike Leaflet (which composites raster PNG tiles) or OpenLayers (which uses Canvas 2D), MapLibre treats the entire map as a scene graph rendered on the GPU using WebGL. Every layer, every feature, every label is a GLSL shader program operating on GPU buffers. The result: silky 60fps pan, zoom, rotate, and 3D tilt with no server round-trips during interaction.
The WebGL Rendering Pipeline #
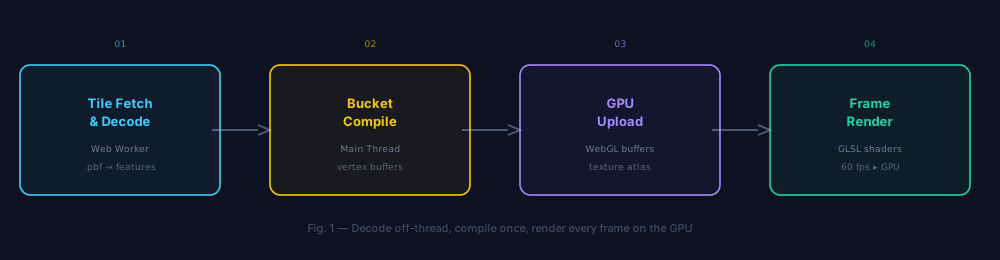
Understanding MapLibre's internal architecture unlocks the ability to write truly performant maps. Every tile load travels through four distinct stages — understanding where CPU vs GPU work happens is critical for diagnosing performance issues.
- 01Tile Fetch & Decode (Web Worker)Vector tiles (.pbf / MVT format) are fetched over HTTP and decoded on a dedicated Web Worker thread. This is critical — parsing happens off the main thread, keeping the UI fully interactive. The output is feature arrays per layer, keyed by source-layer name.
- 02Bucket Compilation (Main Thread CPU)Features are sorted into render 'buckets' per layer type (fill, line, symbol, circle, raster, heatmap). Each bucket pre-computes vertex buffers, index buffers, and collision data. This work is amortized — it runs once per tile on initial load.
- 03GPU Upload (WebGL)Compiled geometry buffers are transferred to the GPU as WebGL buffer objects (VBOs). Symbol placement runs a real-time collision detection pass to decide which labels are visible at the current zoom and rotation. Sprite atlases and SDF glyph textures are loaded as WebGL textures.
- 04Per-Frame Render (GPU)Each animation frame (~16ms), the renderer iterates layers in style order: bind shader, set uniforms (camera matrix, zoom, color stops), issue drawArrays / drawElements. CPU time per frame is under 1ms — the GPU does all heavy lifting.
Next.js Setup #
MapLibre GL JS requires browser APIs — it cannot run during server-side rendering. In Next.js, the correct pattern is to initialize the map in a useEffect hook after the component mounts, using a ref as the container.
1. Install & import CSS
npm install maplibre-gl pmtilesShellAdd the CSS globally in app/layout.jsx or pages/_app.jsx:
// app/layout.jsx (App Router)
import 'maplibre-gl/dist/maplibre-gl.css';JavaScript2. Map component with useRef + useEffect
"use client";
import { useEffect, useRef } from "react";
import maplibregl from "maplibre-gl";
import { Protocol } from "pmtiles";
export default function MapLibreMap({ center = [77.209, 28.6139], zoom = 11 }) {
const containerRef = useRef(null);
const mapRef = useRef(null);
useEffect(() => {
// Register pmtiles:// protocol (run once)
const protocol = new Protocol();
maplibregl.addProtocol("pmtiles", protocol.tile);
mapRef.current = new maplibregl.Map({
container: containerRef.current,
style: {
version: 8,
glyphs: "https://demotiles.maplibre.org/font/{fontstack}/{range}.pbf",
sources: {
basemap: {
type: "vector",
url: "pmtiles://https://your-r2-bucket.example.com/basemap.pmtiles",
},
},
layers: [
{
id: "background",
type: "background",
paint: { "background-color": "#1a1f2e" },
},
{
id: "water",
type: "fill",
source: "basemap",
"source-layer": "water",
paint: { "fill-color": "#0d2137" },
},
{
id: "roads",
type: "line",
source: "basemap",
"source-layer": "roads",
paint: { "line-color": "#3ecfff", "line-width": ["interpolate",["linear"],["zoom"],8,1,14,3] },
},
],
},
center,
zoom,
antialias: true, // smoother edges on high-DPI screens
});
mapRef.current.addControl(new maplibregl.NavigationControl(), "top-right");
mapRef.current.addControl(new maplibregl.ScaleControl(), "bottom-left");
return () => {
mapRef.current?.remove();
maplibregl.removeProtocol("pmtiles");
};
}, []); // eslint-disable-line react-hooks/exhaustive-deps
return (
<div ref={containerRef} style={{ width: "100%", height: "500px", borderRadius: 12 }} />
);
}JSX (Next.js 'use client')dynamic(() => import('./MapLibreMap'), { ssr: false }) to force client-only rendering without needing "use client".PMTiles Integration #
PMTiles is a single-file tile archive served directly from object storage via HTTP Range Requests — no tile server process needed. The pmtiles JS library provides a transparent protocol handler that MapLibre uses exactly like a live tile endpoint.
import { Protocol } from "pmtiles";
import maplibregl from "maplibre-gl";
// ① Register the protocol handler (do this once at app startup)
const protocol = new Protocol();
maplibregl.addProtocol("pmtiles", protocol.tile);
// ② Reference .pmtiles archives using the pmtiles:// scheme
const map = new maplibregl.Map({
container: "map",
style: {
version: 8,
sources: {
buildings: {
type: "vector",
// Points directly at Cloudflare R2 — zero tile server!
url: "pmtiles://https://data.infrynetechworks.com/buildings.pmtiles",
attribution: "© InfryneTechWorks",
},
},
layers: [
{
id: "buildings-3d",
type: "fill-extrusion",
source: "buildings",
"source-layer": "buildings",
paint: {
"fill-extrusion-color": "#3ecfff",
"fill-extrusion-height": ["get", "height"],
"fill-extrusion-opacity": 0.7,
},
},
],
},
center: [77.209, 28.614],
zoom: 15,
pitch: 45, // tilt for 3D view
bearing: -20,
});JavaScriptLayer System & Style Spec #
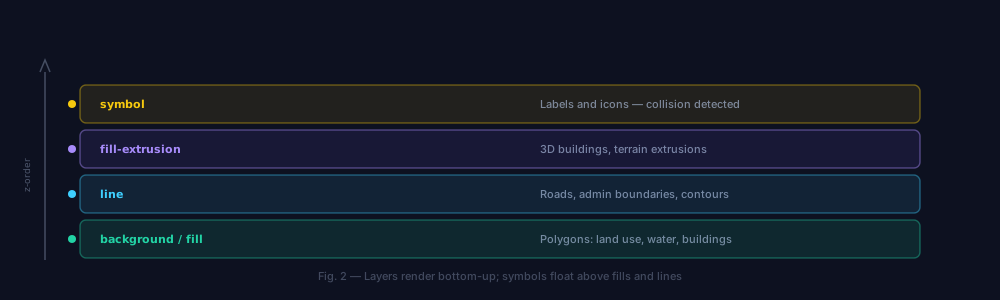
MapLibre's style specification is a JSON document that defines every visual aspect of the map — sources, layers, fonts, sprites. Understanding the layer stack is fundamental to building well-structured map styles.
| Layer Type | Data Input | Key Paint Properties | Best For |
|---|---|---|---|
| background | (none) | background-color | Base fill color or raster pattern |
| fill | Polygon / MultiPolygon | fill-color, fill-opacity | Land use, buildings, regions |
| line | LineString features | line-color, line-width, line-dasharray | Roads, rivers, boundaries |
| fill-extrusion | Polygon with height prop | fill-extrusion-height, fill-extrusion-color | 3D buildings, terrain |
| symbol | Point / any geometry | text-field, icon-image, text-font | Labels, POI icons — GPU collision detection |
| circle | Point features | circle-radius, circle-color | Fast point rendering (no icon atlas needed) |
| heatmap | Point features | heatmap-weight, heatmap-color | Density visualization |
| raster | Raster tile source | raster-opacity, raster-brightness | Satellite, terrain, COG overlays |
Data-Driven Styling
MapLibre expressions let you drive any paint property from feature attributes — no custom code needed. The expression engine runs entirely on the GPU side, making millions of styled features feasible.
// Choropleth: color by population density
{
id: "districts",
type: "fill",
source: "admin",
"source-layer": "districts",
paint: {
"fill-color": [
"interpolate", ["linear"], ["get", "pop_density"],
0, "rgba(34,211,165,0.1)",
500, "rgba(62,207,255,0.5)",
2000, "rgba(248,113,113,0.85)"
],
"fill-opacity": [
"case",
["boolean", ["feature-state", "hover"], false],
0.95, // on hover
0.65 // default
]
}
}JavaScript (style spec)Custom WebGL Layers #
For GPU particle systems, custom shader effects, or 3D point clouds, MapLibre exposes a CustomLayerInterface that plugs directly into the WebGL render loop. You write raw GLSL and MapLibre calls your render() method every frame.
class GlowPointLayer {
constructor(id, coords) {
this.id = id;
this.type = "custom";
this.renderingMode = "2d";
this.coords = coords; // [[lng, lat], ...]
}
onAdd(map, gl) {
this.map = map;
const vert = `
attribute vec2 a_pos;
uniform mat4 u_matrix;
void main() {
gl_Position = u_matrix * vec4(a_pos, 0.0, 1.0);
gl_PointSize = 18.0;
}`;
const frag = `
precision mediump float;
uniform vec4 u_color;
void main() {
float d = length(gl_PointCoord - vec2(0.5));
float alpha = 1.0 - smoothstep(0.15, 0.5, d);
gl_FragColor = vec4(u_color.rgb, alpha * u_color.a);
}`;
const vs = gl.createShader(gl.VERTEX_SHADER);
gl.shaderSource(vs, vert); gl.compileShader(vs);
const fs = gl.createShader(gl.FRAGMENT_SHADER);
gl.shaderSource(fs, frag); gl.compileShader(fs);
this.program = gl.createProgram();
gl.attachShader(this.program, vs);
gl.attachShader(this.program, fs);
gl.linkProgram(this.program);
// Convert lng/lat → Mercator floats
const points = this.coords.flatMap(([lng, lat]) =>
maplibregl.MercatorCoordinate.fromLngLat([lng, lat])
.then ? [] : Object.values(maplibregl.MercatorCoordinate.fromLngLat([lng, lat])).slice(0,2)
);
this.buffer = gl.createBuffer();
gl.bindBuffer(gl.ARRAY_BUFFER, this.buffer);
gl.bufferData(gl.ARRAY_BUFFER, new Float32Array(points), gl.STATIC_DRAW);
this.count = this.coords.length;
}
render(gl, matrix) {
gl.useProgram(this.program);
gl.uniformMatrix4fv(gl.getUniformLocation(this.program, "u_matrix"), false, matrix);
gl.uniform4fv(gl.getUniformLocation(this.program, "u_color"), [0.24, 0.81, 0.63, 0.9]);
gl.bindBuffer(gl.ARRAY_BUFFER, this.buffer);
const loc = gl.getAttribLocation(this.program, "a_pos");
gl.enableVertexAttribArray(loc);
gl.vertexAttribPointer(loc, 2, gl.FLOAT, false, 0, 0);
gl.enable(gl.BLEND);
gl.blendFunc(gl.SRC_ALPHA, gl.ONE); // additive blending for glow
gl.drawArrays(gl.POINTS, 0, this.count);
}
}
map.on("load", () => {
map.addLayer(new GlowPointLayer("glow-points", [
[77.209, 28.614],
[72.877, 19.076],
[80.270, 13.083],
]));
});JavaScriptFeature State for Real-Time Updates #
MapLibre's setFeatureState() API applies property overrides to already-loaded features in O(1) time — no tile re-fetch, no layer re-render, just a GPU uniform update. This is the correct pattern for hover effects, selection highlights, and live data dashboards.
// ── Setup: enable feature state with promoteId ──────────────────────────────
map.addSource("parcels", {
type: "vector",
url: "pmtiles://https://data.infrynetechworks.com/parcels.pmtiles",
promoteId: { parcels: "id" }, // use 'id' field as feature ID
});
map.addLayer({
id: "parcels-fill",
type: "fill",
source: "parcels",
"source-layer": "parcels",
paint: {
"fill-color": [
"case",
["boolean", ["feature-state", "selected"], false], "#3ecfff",
["boolean", ["feature-state", "hover"], false], "rgba(62,207,255,0.4)",
"rgba(34,211,165,0.2)" // default
],
"fill-opacity": 0.8,
"fill-outline-color": "rgba(62,207,255,0.6)"
},
});
// ── Hover effect ─────────────────────────────────────────────────────────────
let hoveredId = null;
map.on("mousemove", "parcels-fill", (e) => {
map.getCanvas().style.cursor = "pointer";
if (e.features.length > 0) {
if (hoveredId !== null)
map.setFeatureState({ source: "parcels", sourceLayer: "parcels", id: hoveredId }, { hover: false });
hoveredId = e.features[0].id;
map.setFeatureState({ source: "parcels", sourceLayer: "parcels", id: hoveredId }, { hover: true });
}
});
map.on("mouseleave", "parcels-fill", () => {
map.getCanvas().style.cursor = "";
if (hoveredId !== null)
map.setFeatureState({ source: "parcels", sourceLayer: "parcels", id: hoveredId }, { hover: false });
hoveredId = null;
});
// ── Click to select ───────────────────────────────────────────────────────────
let selectedId = null;
map.on("click", "parcels-fill", (e) => {
if (selectedId !== null)
map.setFeatureState({ source: "parcels", sourceLayer: "parcels", id: selectedId }, { selected: false });
selectedId = e.features[0].id;
map.setFeatureState({ source: "parcels", sourceLayer: "parcels", id: selectedId }, { selected: true });
});JavaScriptPerformance Optimization #
| Technique | Impact | How To |
|---|---|---|
| Set maxzoom on sources | Reduces tile requests 4× per zoom step | maxzoom: 14 on source; MapLibre overzooms automatically |
| Use promoteId | Enables O(1) feature-state updates | promoteId: { layer: 'id' } in source config |
| Cluster large point datasets | Eliminates symbol collision at low zoom | cluster: true on GeoJSON source |
| Minimize layer count | Each layer = 1+ draw call per tile | Merge line layers; use filter expressions instead of duplicate layers |
| GPU filter expressions | Culls features before upload | filter: ['==', 'class', 'motorway'] on source layer |
| Set tile buffer | Eliminates blank flash on pan | Set buffer: 256 on tile sources for pre-loading |
| Reduce sprite sheet size | Faster texture upload on first render | Only include icons you actually use in the style |
| Use raster-dem for terrain | GPU elevation decoding | maplibregl.setTerrainMeshSize() + DEM tile source |
maxzoom on your tile source. If your data doesn't change between z14 and z22, set maxzoom: 14 and let MapLibre overzoom — you'll serve 4× fewer tiles per zoom level above z14, dramatically cutting bandwidth and tile generation cost.Connecting to Martin Tile Server #
For live PostGIS data, point MapLibre at a Martin microservice instance. Martin exposes a TileJSON endpoint that MapLibre reads automatically to discover source-layers, bounds, and zoom range.
// Dynamic PostGIS data via Martin
map.addSource("live-parcels", {
type: "vector",
// Martin's TileJSON endpoint — auto-discovers layers, bounds, zoom range
url: "https://tiles.infrynetechworks.com/parcels",
});
map.addLayer({
id: "parcels-fill",
type: "fill",
source: "live-parcels",
"source-layer": "parcels",
paint: {
"fill-color": [
"interpolate", ["linear"], ["get", "assessed_value"],
0, "rgba(34,211,165,0.2)",
500000, "rgba(62,207,255,0.6)",
2000000, "rgba(248,113,113,0.85)"
],
"fill-outline-color": "rgba(62,207,255,0.35)"
},
filter: [">=", ["get", "assessed_value"], 0],
});
// Live data refresh (e.g. polling every 30s)
setInterval(() => {
const src = map.getSource("live-parcels");
if (src) src.reload(); // re-fetches tiles for currently visible viewport
}, 30_000);JavaScriptBuilding a Mapping Application?
InfryneTechWorks builds production MapLibre GL JS frontends backed by Martin and PMTiles — from interactive dashboards to real-time fleet tracking.